Capturing Request-Response and Latency Details
Using the watch command, you can collect specific network traffic and parse them into request-response pairs, allowing you to:
- View detailed request-response content.
- Observe latency details, including key timestamps for when a request reaches the network interface, when a response reaches the network interface, when it arrives at the Socket buffer, and when the application process reads the response.
Let's start with a basic example:
kyanos watchSince no filter is specified, kyanos will attempt to capture all traffic it can analyze. Currently, kyanos supports parsing three application-layer protocols: HTTP, Redis, and MySQL.
When you execute this command, you’ll see a table like this: 
TIP
By default, watch collects 100 request-response records. You can specify this using the --max-records option.
Each column represents:
| Column Name | Description | Example |
|---|---|---|
| id | Table's Sequence number | |
| Connection | The connection for this request-response | "10.0.4.9:44526 => 169.254.0.4:80" |
| Proto | Protocol used for the request-response | "HTTP" |
| TotalTime | Total time for this request-response, in milliseconds | |
| ReqSize | Request size, in bytes | |
| RespSize | Response size, in bytes | |
| Net/Internal | If send request as a client, it shows network latency; if received as a server, it shows internal processing time | |
| ReadSocketTime | For client, time spent reading the response from the Socket buffer; for server , reading requests time from the buffer |
You can sort by column using the number keys and navigate through records using the "↑"/"↓" or "k"/"j" keys. Pressing Enter opens the details view for a specific request-response:

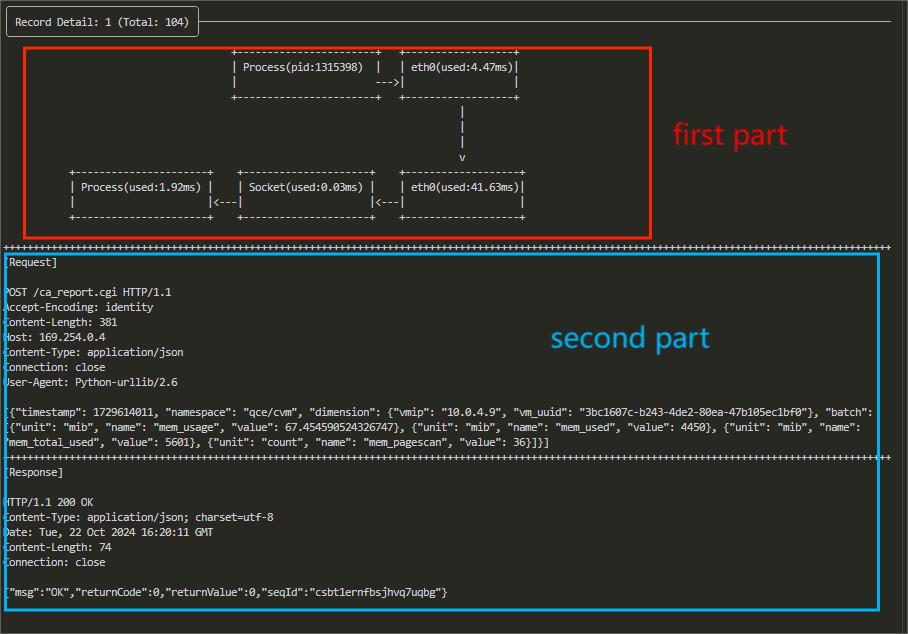
The first part of the details page is Latency Details. Each block represents a node that the data packet passes through, such as processes, network cards, socket buffers, etc. Below each block, there is a latency value, which indicates the time taken from the previous node to this node. You can clearly see the process of the request being sent from the process to the network card, and the response being copied from the network card to be read by the process, along with the latency of each step.
TIP
If you want to see the latency for copying data from the network card to the TCP buffer and reading data from the buffer to the process, you can add --trace-socket-event to the watch options:  You will see an additional Socket block in the latency visualization chart.
The second part is Basic Information of the Request and Response, which includes the start and end times of the request and response, the size of the request and response, etc.
The third part is Specific Content of the Request and Response, divided into Request and Response sections. Content exceeding 1024 bytes will be truncated for display, but you can adjust this limit using the --max-print-bytes option.
How to Filter Requests and Responses ?
By default, kyanos captures all traffic for the protocols it currently supports. However, in many scenarios, you might need to filter more precisely. For example, you may want to focus on requests sent to a specific remote port, or related to a certain process or container, or queries tied to specific Redis commands or HTTP paths.
Below are the ways to use kyanos options to filter request-responses you're interested in.
Filtering by IP and Port
kyanos supports filtering based on IP and port at the network layer (Layer 3/4). You can specify the following options:
| Filter Condition | Command Line Flag | Example |
|---|---|---|
| Local Connection Ports | local-ports | --local-ports 6379,16379 Only observe request-responses on local ports 6379 and 16379. |
| Remote Connection Ports | remote-ports | --remote-ports 6379,16379 Only observe request-responses on remote ports 6379 and 16379. |
| Remote IP Addresses | remote-ips | --remote-ips 10.0.4.5,10.0.4.2 Only observe request-responses from remote IPs 10.0.4.5 and 10.0.4.2. |
| Client/Server side | side | --side client/server Only observe requests and responses when acting as a client initiating connections or as a server receiving connections. |
Filtering by Process/Container
| Filter Condition | Command Line Flag | Example |
|---|---|---|
| Process PID List | pids | --pids 12345,12346 Separate multiple PIDs with commas. |
| Process Name | comm | --comm 'curl' |
| Container ID | container-id | --container-id xx Specify the container ID. |
| Container Name | container-name | --container-name foobar Specify the container name. |
| Kubernetes Pod Name | pod-name | --pod-name nginx-7bds23212-23s1s.default Format: NAME.NAMESPACE |
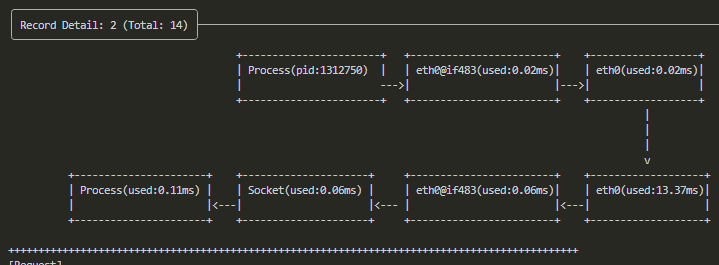
It's worth mentioning that kyanos also displays latency between the container network card and the host network card: 
Filtering by Request-Response General Information
| Filter Condition | Command Line Flag | Example |
|---|---|---|
| Request-Response Latency | latency | --latency 100 Only observe request-responses that exceed 100ms in latency. |
| Request Size in Bytes | req-size | --req-size 1024 Only observe request-responses larger than 1024 bytes. |
| Response Size in Bytes | resp-size | --resp-size 1024 Only observe request-responses larger than 1024 bytes. |
Filtering by Protocol-Specific Information
You can choose to capture only request-responses for a specific protocol by adding the protocol name as subcommand. The currently supported protocols are:
httpredismysql
For example, to capture only HTTP requests to the path /foo/bar, you would run:
kyanos watch http --path /foo/barHere are the options available for filtering by each protocol:
HTTP Protocol Filtering
| Filter Condition | Command Line Flag | Example |
|---|---|---|
| Request Path | path | --path /foo/bar Only observe requests with the path /foo/bar. |
| Request Path Prefix | path-prefix | --path-prefix /foo/bar Only observe requests with paths started with /foo/bar. |
| Request Path Regex | path-regex | --path-regex "\/foo\/bar\/.*" Only observe requests with paths matching the regex \/foo\/bar\/.*. |
| Request Host | host | --host www.baidu.com Only observe requests with the host www.baidu.com. |
| Request Method | method | --method GET Only observe requests with the method GET. |
Redis Protocol Filtering
| Filter Condition | Command Line Flag | Example |
|---|---|---|
| Request Command | command | --command GET,SET Only observe requests with the commands GET and SET. |
| Request Key | keys | --keys foo,bar Only observe requests with the keys foo and bar. |
| Request Key Prefix | key-prefix | --key-prefix foo:bar Only observe requests with keys that have the prefix foo:bar. |
RocketMQ Protocol Filtering preview
| Filter Condition | Command Line Flag | Example |
|---|---|---|
| Request Codes | request-codes | --request-codes 10,11 Only observe requests with the codes 10 and 11. |
| Languages | languages | --languages Java,Go Only observe requests from applications written in Java and Go. |
For the meaning and usage of Request Codes, please refer to here.
For more supported languages, please refer to here.
Kafka Protocol Filtering preview
| Filter Condition | Command Line Flag | Example |
|---|---|---|
| Topic Name | topic | --topic quickstart-events |
| Producer | producer | --producer Observe producer requests, useful when specifying a topic, default is true |
| Consumer | consumer | --consumer Observe consumer requests, useful when specifying a topic, default is true |
| API Keys | apikeys | --apikeys 10,11 Only observe Kafka APIKEYs 10 and 11 |
For the meaning and values of API Keys, refer to here.
DNS Protocol Filtering preview
| Filter Condition | Command Line Flag | Example |
|---|---|---|
| host | host | --host example.com |
MySQL Protocol Filtering
MySQL protocol capturing is supported, but filtering by conditions is still in development...
TIP
All of the above options can be combined. For example:
./kyanos watch redis --keys foo,bar --remote-ports 6379 --pid 12345This flexibility allows you to tailor your traffic capture to your specific needs, ensuring you gather only the most relevant request-response data.
JSON Output preview
If you need to process the captured data programmatically, you can use the --json-output flag to output the results in JSON format:
# Output to terminal
kyanos watch --json-output=stdout

# Output to a file
kyanos watch --json-output=/path/to/custom.json
The JSON output will contain detailed information for each request-response pair including:
- Timestamps for request and response
- Connection details (addresses and ports)
- Protocol-specific information
- Detailed latency metrics
- Request and response content
For the complete JSON output format specification, please refer to the JSON Output Format documentation.
