What is kyanos ?
Kyanos is a Network Traffic Analyzer that provides real-time, packet-level to protocol-level visibility into a host's internal network, capturing and analyzing all inbound and outbound traffic.
Why Kyanos?
There are already many network troubleshooting tools available, such as tcpdump, iftop, and netstat. So, what benefits does Kyanos offer?
Drawbacks of Traditional Packet Capture with tcpdump
- Difficulty filtering based on protocol-specific information: For example, in the case of the HTTP protocol, it's challenging to capture packets based on a specific HTTP path, requiring tools like Wireshark/tshark for secondary filtering.
- Difficulty filtering packets based on the sending or receiving process/container: especially when multiple processes or containers are deployed on a single machine and you only need to capture packets for a specific process/container.
- Low troubleshooting efficiency: The typical troubleshooting process involves using tcpdump in the production environment to capture packets and generate a pcap file, then downloading it locally for analysis with tools like Wireshark/tshark, often consuming a significant amount of time.
- Limited analysis capabilities: Tcpdump only provides basic packet capture capabilities with minimal advanced analysis, requiring pairing with Wireshark. Traditional network monitoring tools like iftop and netstat offer only coarse-grained monitoring, making it challenging to identify root causes.
- Lacking the functionality to analyze encrypted traffic: such as SSL protocol requests, cannot be viewed in plain text.
What Kyanos Can Offer You
- Powerful Traffic Filtering: Not only can filter based on traditional IP/port information, can also filter by process/container, L7 protocol information, request/response byte size, latency, and more.
# Filter by pid
./kyanos watch --pids 1234
# Filter by container id
./kyanos watch --container-id abc
# Filter by Redis key
./kyanos watch redis --keys my-key1,my-key2
# Filter by response byte size
./kyanos watch --resp-size 10000
Advanced Analysis Capabilities : Unlike tcpdump, which only provides fine-grained packet capture, Kyanos supports aggregating captured packet metrics across various dimensions, quickly providing the critical data most useful for troubleshooting.
Imagine if the bandwidth of your HTTP service is suddenly maxed out—how would you quickly analyzewhich IPsandwhich requestsare causing it?
With Kyanos, you just need one command:kyanos stat http --bigrespto find the largest response byte sizes sent to remote IPs and view specific data on request and response metrics.
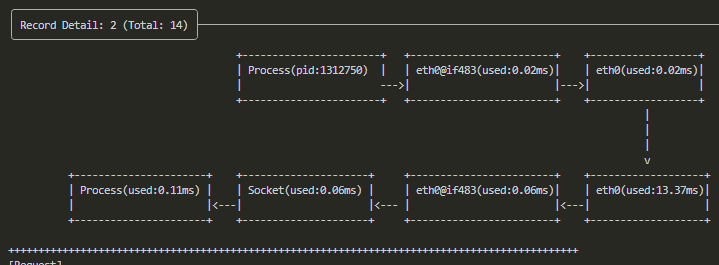
In-Depth Kernel-Level Latency Details: In real-world, slow queries to remote services like Redis can be challenging to diagnose precisely. Kyanos provides kernel trace points from the arrival of requests/responses at the network card to the kernel socket buffer, displaying these details in a visual format. This allows you to identify exactly which stage is causing delays.

Lightweight and Dependency-Free: Almost zero dependencies—just a single binary file and one command, with all results displayed in the command line.
Automatic SSL Traffic Decryption : All captured requests and responses are presented in plaintext.
When to Use Kyanos
- Capture Request and Response
Kyanos provides the watch command, allowing you to filter and capture various traffic types. It supports filtering based on process ID, container ID, container name, pod name, as well as IP and port. Additionally, you can filter based on protocol-specific fields, such as HTTP paths, Redis commands, and keys. The captured traffic includes not only the request and response content but also detailed timing information, such as the time taken for requests to go from system calls to the network card and for responses to travel from the network card to the socket buffer and then to the process.
- Analyze Abnormal Flow Path
Kyanos’s stat command can help you quickly identify abnormal links. The stat command supports aggregation across multiple dimensions.
For example, it can aggregate by remote IP, allowing you to quickly analyze which remote IP is slower. Kyanos also supports various metrics, such as request-response latency and request-response size. With these features, you can resolve 80% of network issues quickly.
- Global Dependency Analysis beta
Sometimes, you may need to know which external resources a machine depends on. Kyanos offers the overview command to capture all external resources a machine relies on and their latency in a single command.
Basic Examples
Capture HTTP Traffic with Latency Details
Run the command:
./kyanos watch httpThe result is as follows:

Capture Redis Traffic with Latency Details
Run the command:
./kyanos watch redisThe result is as follows:

Identify the Slowest Requests in the Last 5 Seconds
Run the command:
./kyanos stat --slow --time 5The result is as follows:

